As I'm working on the visual team for Project 1, I've been looking at a good amount of timelines, infographics, and ways of charting and organizing data. A few of the most inspiring projects I found were the following:
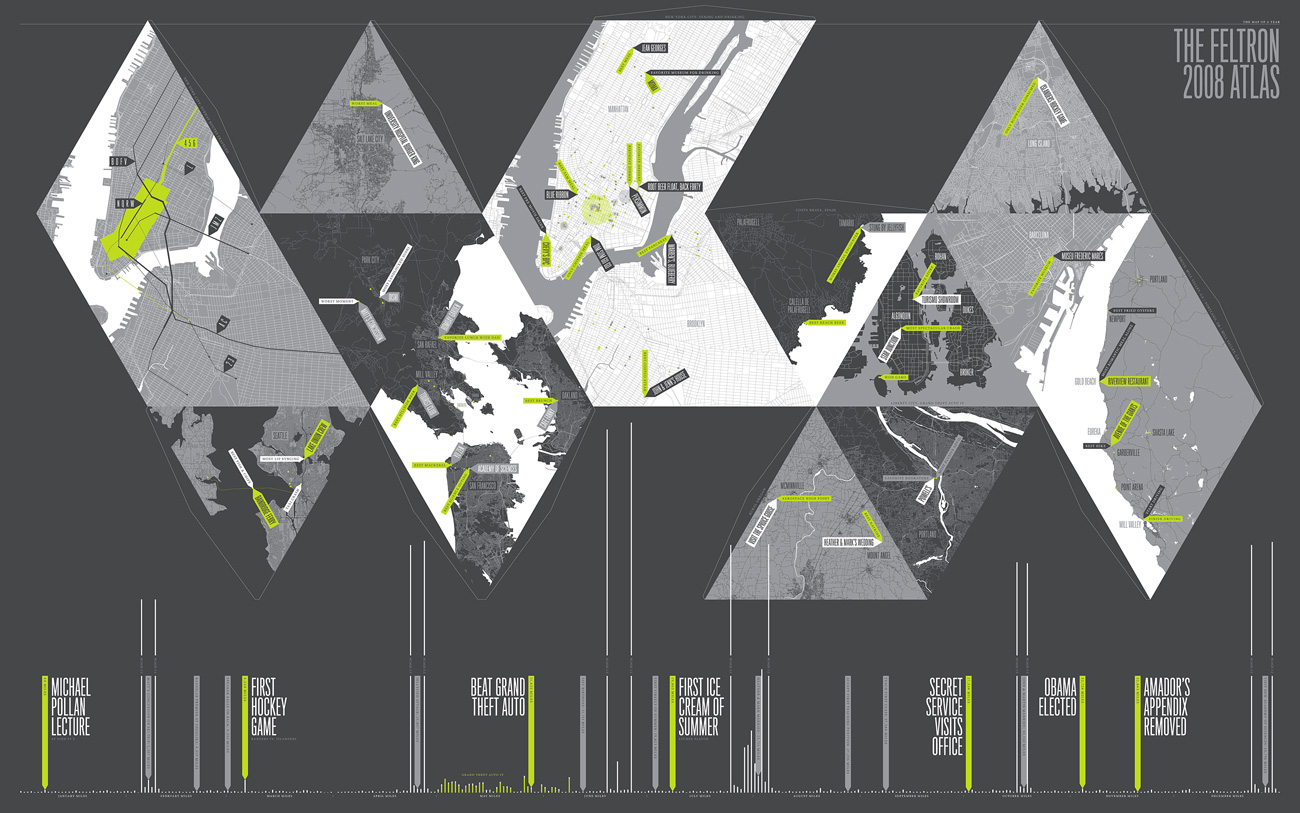
The Feltron Annual Report by Nicholas Felton:


No comments:
Post a Comment